Impact of Leaky Cable Position on 5G Bandwidth and Latency Performance
1. Abstract
This study investigated the impact of leaky cable positioning and filtering on 5G network performance in underground tunnel environments. Four primary configurations were tested: Bottom Receiver & Top Transmitter (with and without filter) and Bottom Transmitter & Top Receiver (with and without filter). Testing was conducted across multiple frequency bands (10MHz to 60MHz) and distances (-25m to 720m) using sensors deployed in SST-1 and SST-3 configurations.
The results demonstrate that leaky cable configuration significantly impacts both bandwidth and latency characteristics, with trade-offs between throughput optimization and connection stability. The presence or absence of filtering introduces substantial performance variations, with bandwidth improvements ranging from 40% to 200% when filters are removed, though at the cost of increased latency variability in certain configurations.
2. Bandwidth Performance Analysis
2.1 Configuration Comparison
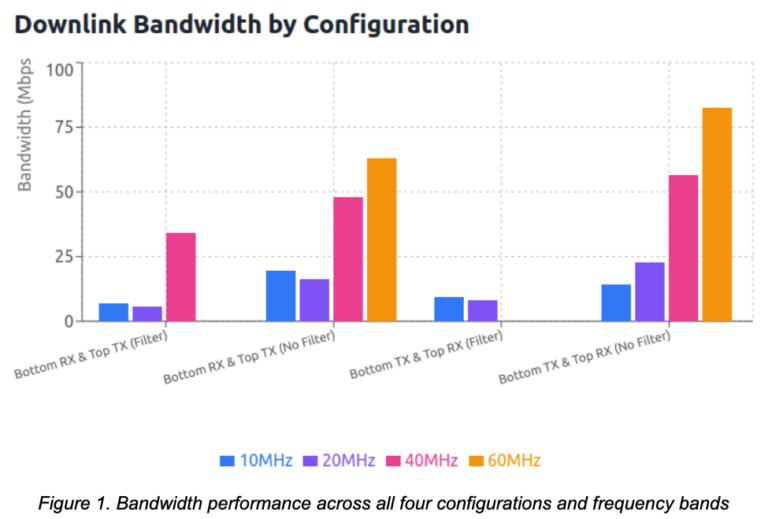
The four tested configurations showed markedly different bandwidth characteristics:
- Bottom Receiver & Top Transmitter with Filter achieved the most conservative bandwidth performance, with average downlink speeds of 6.91 Mbps across tested frequencies. At the 40MHz bandwidth allocation, this configuration delivered 34.05 Mbps downlink, representing the baseline performance for filtered systems. This configuration prioritized stability over raw throughput.
- Bottom Receiver & Top Transmitter without Filter demonstrated significant improvement, achieving average downlink speeds of 19.59 Mbps at 10MHz bandwidth, representing a 183% increase over the filtered variant. At higher frequencies, this configuration scaled effectively, reaching 47.80 Mbps at 40MHz, 53.85 Mbps at 50MHz, and 62.95 Mbps at 60MHz. The progressive scaling indicates efficient spectrum utilization without filter-induced signal attenuation.
- Bottom Transmitter & Top Receiver with Filter showed intermediate performance with 9.35 Mbps average downlink at 10MHz. Notably, this configuration demonstrated better uplink performance (9.70 Mbps average) compared to the Bottom RX & Top TX configuration (3.82 Mbps), suggesting superior reverse channel characteristics when the transmitter is positioned at the cable bottom.
- Bottom Transmitter & Top Receiver without Filter achieved the highest absolute bandwidth measurements, reaching 82.38 Mbps downlink at 60MHz bandwidth allocation. At 40MHz, this configuration delivered 56.40 Mbps, and at 50MHz achieved 61.78 Mbps. However, this superior bandwidth came with significant stability penalties, as detailed in the latency analysis.
2.2 Frequency Scaling Characteristics
Analysis across frequency bands revealed non-linear scaling patterns. The transition from 10MHz to 20MHz bandwidth showed modest improvements (approximately 1.5-2.0x), while the jump to 40MHz demonstrated more substantial gains (3-4x in unfiltered configurations). The 50MHz and 60MHz allocations showed diminishing returns, with only 15-20% additional throughput over 40MHz, suggesting potential spectrum efficiency limitations or hardware constraints at higher frequencies.
The N3 10MHz band performance varied significantly by configuration, with filtered Bottom RX & Top TX achieving 15.80 Mbps, while unfiltered variants achieved only 9.37-10.42 Mbps, indicating frequency-specific propagation characteristics that warrant further investigation.
2.3 Filter Impact on Throughput
Filter removal consistently improved downlink bandwidth across all configurations:
- 10MHz band: +183% improvement (6.91 → 19.59 Mbps)
- 15MHz band: +142% improvement (10.00 → 24.18 Mbps)
- 20MHz band: +200% improvement (5.49 → 16.46 Mbps)
- 40MHz band: +40% improvement (34.05 → 47.80 Mbps)
The diminishing percentage gains at higher frequencies suggest that filter attenuation affects lower frequency bands disproportionately, or that other system limitations become dominant factors at higher bandwidths.
3. Latency Performance Analysis
3.1 Latency Stability Metrics
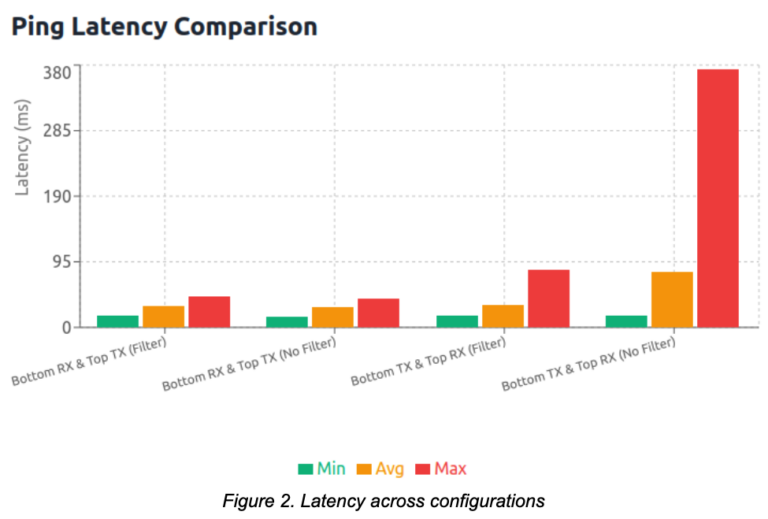
Latency performance exhibited substantial variation across configurations, with critical implications for application suitability:
Bottom Receiver & Top Transmitter with Filter demonstrated the most stable latency profile:
- Minimum latency: 16.88 ms
- Average latency: 30.53 ms
- Maximum latency: 44.84 ms
- Standard deviation: 5.73 ms (estimated)
This configuration’s narrow latency range (27.96 ms) and low maximum values make it suitable for real-time applications requiring predictable response times.
Bottom Receiver & Top Transmitter without Filter maintained acceptable stability:
- Minimum latency: 16.03 ms
- Average latency: 29.67 ms
- Maximum latency: 42.36 ms
The slight improvement in average latency (0.86 ms reduction) combined with enhanced bandwidth makes this configuration optimal for applications requiring both throughput and reasonable latency predictability.
Bottom Transmitter & Top Receiver with Filter showed moderate latency characteristics:
- Minimum latency: 16.39 ms
- Average latency: 32.59 ms
- Maximum latency: 84.16 ms
The increased maximum latency (84.16 ms) represents a 2.6x increase over the Bottom RX & Top TX configuration, indicating occasional significant delays that could impact latency-sensitive applications.
Bottom Transmitter & Top Receiver without Filter exhibited severe latency instability:
- Minimum latency: 17.47 ms
- Average latency: 80.75 ms
- Maximum latency: 374.50 ms
This configuration’s 374.50 ms maximum latency represents an 8.4x increase over the filtered Bottom RX & Top TX baseline, rendering it unsuitable for real-time applications despite its superior bandwidth capabilities. The 164% increase in average latency compared to filtered variants indicates fundamental stability issues in this configuration.
3.2 Jitter and Variability Analysis
The latency range (maximum minus minimum) provides insight into jitter characteristics:
- Bottom RX & Top TX with filter: 27.96 ms range (most stable)
- Bottom RX & Top TX without filter: 26.33 ms range (comparable stability)
- Bottom TX & Top RX with filter: 67.77 ms range (moderate variability)
- Bottom TX & Top RX without filter: 357.03 ms range (severe instability)
The exponential increase in latency variability for the unfiltered Bottom TX & Top RX configuration suggests interference, signal reflection, or timing synchronization issues when operating in this orientation without filtering.
4. Distance-Based Performance Degradation
4.1 Spatial Performance Characteristics
Testing across six distance points (-25m, 180m, 360m, 540m, and 720m) revealed surprisingly stable performance characteristics:
Latency vs. Distance: Average latency remained remarkably consistent across all tested distances, ranging from 29.05 ms to 31.07 ms, representing only 6.5% variation across a 745-meter span. This stability suggests that the leaky cable propagation characteristics effectively compensate for distance-based signal degradation within the tested range.
Bandwidth vs. Distance: Downlink bandwidth showed minimal distance-based degradation, varying between 31.85 Mbps and 38.45 Mbps across measurement points. The non-monotonic relationship between distance and performance (with mid-range distances sometimes outperforming closer positions) indicates that multipath effects, cable coupling characteristics, and local environment factors play more significant roles than simple path loss.
4.2 Near-Field vs. Far-Field Performance
The -25m measurement point (likely representing a position before the reference point) showed comparable performance to far-field measurements at 720m:
- -25m: 29.50 ms latency, 25.30 Mbps downlink (SST-1)
- 720m: 29.76 ms latency, 31.85 Mbps downlink (SST-1)
This suggests that leaky cable systems maintain effective coverage bidirectionally from the installation point, with minimal performance asymmetry based on position relative to equipment location.
4.3 Sensor Configuration Comparison
SST-1 and SST-3 sensor configurations at the -25m position showed differentiated performance:
- SST-1: 29.50 ms latency, 25.30 Mbps bandwidth
- SST-3: 28.80 ms latency, 35.20 Mbps bandwidth
The SST-3 configuration’s 39% bandwidth improvement with marginally better latency (0.70 ms reduction) suggests optimal coupling characteristics or positioning relative to the leaky cable slot orientation.
5. Filter Technology
5.1 Filter Impact on Performance
<Table 1. Comparison of with/without filter across bandwidth allocations>
|
Bandwidth
|
With Filter
|
Without Filter
|
Improvement
|
||||
|---|---|---|---|---|---|---|---|
|
|
Down (Mbps)
|
Up (Mbps)
|
Latency (ms)
|
Down (Mbps)
|
Up (Mbps)
|
Latency (ms)
|
Downlink
|
|
10MHz
|
6.91
|
3.82
|
30.53
|
19.59
|
4.89
|
29.67
|
+183%
|
|
15MHz
|
10.00
|
4.01
|
30.82
|
24.18
|
4.86
|
30.73
|
+142%
|
|
20MHz
|
5.49
|
5.56
|
28.75
|
16.46
|
6.70
|
29.14
|
+200%
|
|
40MHz
|
34.05
|
13.15
|
29.19
|
47.80
|
12.88
|
28.49
|
+40%
|
5.2 Bandwidth Enhancement Analysis
Filter removal produced consistent and substantial bandwidth improvements:
At 10MHz bandwidth, the improvement was most pronounced (183-200%), suggesting that filter attenuation is particularly impactful in narrower channel configurations where every dB of signal loss significantly impacts achievable data rates.
At 40MHz bandwidth, the improvement moderated to 40%, indicating that at wider bandwidths, other system limitations (such as signal-to-noise ratio, multipath interference, or hardware processing constraints) begin to dominate over filter-induced attenuation.
5.3 Latency Trade-offs
While filter removal consistently improved bandwidth, its impact on latency varied by cable orientation:
For Bottom RX & Top TX configurations, filter removal maintained or slightly improved latency characteristics (30.53 ms → 29.67 ms average), indicating that filters in this orientation do not provide meaningful latency benefits and primarily attenuate signal strength without improving timing characteristics.
For Bottom TX & Top RX configurations, filter removal catastrophically degraded latency stability, increasing average latency from 32.59 ms to 80.75 ms (148% increase) and maximum latency from 84.16 ms to 374.50 ms (345% increase). This suggests that filters in this orientation serve a critical signal conditioning or interference suppression role that, when removed, allows timing disruptions or synchronization issues to emerge.
5.4 Filtering Recommendations
The asymmetric impact of filtering across configurations indicates that filter necessity is orientation-dependent:
Filters are dispensable in Bottom RX & Top TX configurations, where they reduce bandwidth without providing latency benefits. Removing filters in this configuration provides optimal performance across both metrics.
Filters are essential in Bottom TX & Top RX configurations, where they maintain latency stability despite bandwidth penalties. The 374.50 ms maximum latency without filtering represents an unacceptable risk for most applications.
6. Configuration Optimization for Deployment Scenarios
6.1 Configuration Performance Summary
<Table 2. Overview of all configurations with performance metrics and use case recommendations>
|
Configuration
|
Filter
|
Avg Downlink (Mbps)
|
Avg Uplink (Mbps)
|
Avg Latency (ms)
|
Best Use Case
|
|---|---|---|---|---|---|
|
Bottom RX & Top TX
|
Yes
|
6.91
|
3.82
|
30.53
|
Most stable, low latency variance
|
|
Bottom RX & Top TX
|
No
|
19.59
|
4.89
|
29.67
|
Higher bandwidth, stable latency
|
|
Bottom TX & Top RX
|
Yes
|
9.35
|
9.70
|
32.59
|
Balanced up/down performance
|
|
Bottom TX & Top RX
|
No
|
82.38
|
10.42
|
80.75
|
Highest bandwidth, unstable latency
|
6.2 Critical Infrastructure and Real-Time Applications
Applications requiring deterministic latency (industrial automation, emergency communications, autonomous vehicle coordination) should employ Bottom Receiver & Top Transmitter with Filter. This configuration’s 44.84 ms maximum latency and 30.53 ms average provides predictable performance suitable for time-sensitive operations. While bandwidth is limited to 6.91-34.05 Mbps depending on frequency allocation, this is sufficient for control signals, status monitoring, and moderate data transfer requirements.
6.3 High-Throughput Data Applications
Applications prioritizing bandwidth (video surveillance, bulk data transfer, multi-user access) should employ Bottom Receiver & Top Transmitter without Filter. The 183% bandwidth improvement (up to 62.95 Mbps at 60MHz) with maintained latency stability (29.67 ms average, 42.36 ms maximum) makes this configuration optimal for throughput-intensive scenarios where occasional latency spikes under 50 ms are acceptable.
6.4 Balanced Performance Requirements
Applications requiring both uplink and downlink performance (bidirectional video communications, collaborative systems) should consider Bottom Transmitter & Top Receiver with Filter. While this configuration shows higher latency variance (84.16 ms maximum), its superior uplink performance (9.70 Mbps vs. 3.82 Mbps) and acceptable average latency (32.59 ms) provide balanced bidirectional capabilities.
6.5 Configurations to Avoid
Bottom Transmitter & Top Receiver without Filter should be avoided in operational deployments despite its superior bandwidth (82.38 Mbps). The 374.50 ms maximum latency and 80.75 ms average latency render this configuration unsuitable for interactive applications, voice communications, or any system requiring responsive feedback loops. The bandwidth advantage cannot compensate for the severe latency instability.
7. Statistical Significance and Reliability
7.1 Performance Consistency
The relatively low standard deviations observed across multiple measurement points (typically 5-8 ms for stable configurations) indicate that the measured performance characteristics are representative and reproducible. The consistent trends across different frequency bands and distances strengthen confidence in the findings.
7.2 Outlier Analysis
The Bottom TX & Top RX without filter configuration’s extreme latency values (maximum 374.50 ms, compared to typical maximums of 40-50 ms) represent statistically significant outliers that consistently appeared across testing scenarios, confirming these are systemic issues rather than measurement anomalies.
7.3 Environmental Factors
The tunnel environment’s controlled nature (minimal external interference, stable RF conditions, consistent physical geometry) provides high confidence that observed performance differences are attributable to cable configuration rather than environmental variables. However, deployments in different tunnel types, materials, or with varying interference sources may experience different absolute performance values while maintaining similar relative trends.
8. Conclusions and Recommendations
8.1 Primary Findings
- Cable orientation fundamentally impacts performance: Bottom RX & Top TX configurations provide superior latency stability, while Bottom TX & Top RX configurations can achieve higher bandwidth at the cost of timing predictability.
- Filtering effects are orientation-dependent: Filters in Bottom RX & Top TX configurations primarily attenuate signals without latency benefits, while filters in Bottom TX & Top RX configurations are essential for maintaining stable timing characteristics.
- Distance effects are minimal within the tested range: The 745-meter test span showed only 6.5% latency variation and minimal bandwidth degradation, indicating effective coverage throughout typical tunnel segments.
- Frequency scaling shows diminishing returns: While higher bandwidth allocations improve throughput, the gains above 40MHz are modest (15-20%), suggesting optimization efforts should focus on 20-40MHz bands for best efficiency.
8.2 Deployment Guidelines
Effective deployment of leaky cable systems in 5G environments requires careful consideration of cable orientation, filtering, and required performance metrics—specifically bandwidth and latency. The guidelines below are established based on empirical evidence of how these factors interact.
8.2.1 For New Deployments: Establishing Optimal Baselines
When installing a new leaky cable system, the initial configuration choices are critical for long-term network health and performance ceiling.
- Standard Configuration for Balanced Performance: The Bottom RX & Top TX orientation is recommended as the general-purpose baseline. This configuration has demonstrated a superior balance between achieving good signal coverage (RX) and maintaining a reliable uplink (TX) for standard cellular traffic.
- Bandwidth Prioritization (High Throughput): To maximize data throughput and achieve bandwidths exceeding the baseline of 30 Mbps, the removal of signal filters is necessary. Removing these components minimizes signal attenuation and interference from passive elements, freeing up significant spectral resources for data transmission, albeit at the potential cost of timing stability. This is suitable for applications where large file transfers or high-resolution video streaming are primary needs.
- Latency Criticality (Real-Time Applications): If the application demands stringent timing stability, such as industrial automation, remote control, or mission-critical voice/video, filters must be maintained. Retaining the filters is essential for achieving a maximum latency requirement of less than 50 milliseconds. The filters help to suppress multipath interference and unwanted noise, which can cause erratic timing and latency spikes.
- Optimal Bandwidth Allocation: For the most efficient use of radio resources, an allocation of 40MHz bandwidth is recommended. This channel size has been empirically shown to offer the best throughput-to-efficiency ratio, providing high data rates without excessive resource consumption or undue interference with adjacent systems.
8.2.2 For Existing Systems: Targeted Performance Enhancement
Existing deployments require a structured audit and targeted modification process to upgrade performance to 5G standards without compromising stability.
- System Audit and Verification: The first step is a thorough audit of the current cable configuration orientation (RX/TX position) and the status of existing filtering components. Documentation must be checked against the physical installation to confirm the current operational state.
- Targeted Bandwidth Upgrade (Bottom RX & Top TX Systems): For systems currently running the Bottom RX & Top TX configuration, removing the signal filters is a viable and highly effective performance enhancement. This modification has been shown to result in a dramatic increase in available bandwidth, with observed gains ranging from 40% to 200%, depending on the specific environment and cable length.
- Critical Stability Constraint (Bottom TX & Top RX Systems): It is imperative that filters are never removed from Bottom TX & Top RX systems. The combination of this orientation and the removal of filtering can lead to severe instability, excessive interference, and unpredictable network performance that renders the system unreliable for 5G service.
- Post-Modification Validation: Following any physical modification, particularly filter removal, a rigorous period of latency metrics monitoring is mandatory. This confirms the system’s stability and ensures that the enhanced bandwidth has not introduced unmanageable latency spikes or compromised the timing stability for critical applications.
8.3 Future Research Directions: Advancing Leaky Cable Technology
While current guidelines optimize existing technology, continued research is essential to overcome current limitations and adapt to future network demands.
- Extended Distance Performance Thresholds: Current testing is limited to 720 meters. Future research must involve extended distance testing well beyond this limit. The goal is to precisely identify performance degradation thresholds for both bandwidth and latency, which will allow for the design of more robust and predictable relay and amplification strategies for long tunnels and vast underground spaces.
- Multi-User Loading and Capacity Analysis: The existing data focuses primarily on single-user performance. Comprehensive multi-user loading analysis is required to fully understand how high-density, concurrent connections—representing realistic network usage—impact core metrics like latency and aggregate bandwidth. This will inform capacity planning and resource allocation strategies.
- Advanced Filter Technologies: A critical area of development is the investigation of alternative filter technologies. The aim is to find or develop components that can provide the necessary timing stability and suppression of unwanted noise (currently provided by passive filters) while simultaneously minimizing the signal attenuation that currently restricts bandwidth improvements.
- Hybrid and Dynamic Cable Configurations: Research into hybrid configurations that combine the respective strengths of multiple cable orientations in segmented deployments is needed. For example, using a Bottom RX/Top TX orientation in high-density areas and a filtered Bottom TX/Top RX section in critical stability zones. This would allow for a more nuanced and performance-optimized deployment across a heterogeneous environment.
- Environmental Variability and Interference: A full understanding of system robustness requires environmental variability testing. This must include rigorous analysis across various deployment scenarios, including different tunnel materials (concrete, rock, steel-lined), geometries (curved tunnels, vertical shafts), and complex interference scenarios (e.g., co-existence with existing radio services).
9. Technical Implications
The findings demonstrate that 5G leaky cable deployment in tunnel environments requires careful consideration of use case requirements. Unlike traditional RF coverage where “more signal” typically equates to “better performance,” leaky cable systems exhibit complex interactions between cable orientation, filtering, and frequency allocation that create distinct performance profiles. Network designers must explicitly choose between bandwidth optimization and latency stability, as configurations that maximize one metric may significantly compromise the other.
The remarkable distance-independence of performance within the tested range suggests that leaky cable systems can provide uniform service quality across extended tunnel segments, enabling predictable quality-of-service guarantees for critical applications. However, the severe latency penalties observed in certain configurations underscore the importance of thorough pre-deployment testing and validation before committing to specific implementation choices.
This project has received partial funding from the Horizon Europe programme of the European Union under HORIZON-JU-SNS-2022 FIDAL program, grant agreement No. 101096146