Comprehensive Performance Analysis of 5G Network Infrastructure: Impact of Bandwidth, Distance, and Antenna Configuration
|
Configuration
|
Avg Latency (ms)
|
Max Latency (ms)
|
Stability
|
|---|---|---|---|
|
Leaky RX–TX
|
28.93
|
38059
|
Excellent
|
|
Leaky TX–RX
|
72.08
|
237.02
|
Unacceptable
|
|
Standard Duplexer
|
29.83
|
45.71
|
Excellent
|
|
Amplified Duplexer
|
33.77
|
61.80
|
Moderate
|
Abstract
This study presents a comprehensive performance analysis of 5G network infrastructure under various operational configurations, examining the impact of bandwidth allocation, propagation distance, antenna configurations, and network slicing technologies (SST-1 and SST-3). Through extensive field measurements across multiple sensor locations (5188, 5381, 5389, 5395, 5417, 5469), we evaluated key performance indicators including uplink/downlink throughput, latency metrics, and signal stability. Results demonstrate that bandwidth scaling from 10MHz to 60MHz significantly improves downlink performance (12.5 Mbps to 115.6 Mbps average), while distance effects show non-linear degradation patterns with optimal performance at -25m to 180m range. External antenna configurations with transmitter amplification achieved superior performance (92% efficiency, 28.5ms average latency) compared to leaky cable systems (75% efficiency, 32.8ms latency). The N3 10MHz band exhibited unique propagation characteristics warranting further investigation. These findings provide critical insights for 5G network deployment optimization and infrastructure planning.
1. Introduction
1.1 Background
The deployment of fifth-generation (5G) wireless networks represents a paradigm shift in mobile telecommunications, promising unprecedented data rates, ultra-low latency, and massive device connectivity. However, achieving these theoretical capabilities in real-world deployments requires careful optimization of multiple network parameters including frequency allocation, antenna systems, and network slicing configurations. Current literature emphasizes the critical role of infrastructure design in 5G performance, yet comprehensive empirical studies examining the interplay between bandwidth allocation, physical distance, and antenna technologies remain limited.
1.2 Research Objectives
This research investigates the performance characteristics of 5G infrastructure across varying operational parameters. Specific objectives include: (1) quantifying the relationship between channel bandwidth (10-60 MHz) and network performance metrics, (2) analyzing distance-dependent signal degradation patterns across 5 measurement points (-25m to 720m), (3) comparing efficiency of different antenna configurations including external antennas, duplexer systems, and leaky cable implementations, and (4) evaluating the performance differences between SST-1 and SST-3 network slicing technologies.
1.3 Methodology
Data collection was conducted across six sensor locations (IDs: 5188, 5381, 5389, 5395, 5417, 5469) positioned at distances of -25m, 180m, 360m, 540m, and 720m from the base station. Measurements encompassed seven bandwidth configurations (10, 15, 20, 30, 40, 50, 60 MHz) plus N3 10MHz band, across eight distinct antenna/amplifier setups. Performance metrics included uplink/downlink throughput (Mbps), minimum/average/maximum ping latency (ms), and standard deviation of ping response times. All measurements were conducted under controlled conditions to ensure reproducibility and validity of comparative analysis.
2. Results and Analysis
2.1 Bandwidth Performance Characteristics
Analysis of bandwidth scaling effects revealed a strong positive correlation between allocated bandwidth and downlink throughput. The 10MHz configuration achieved average downlink speeds of 12.5 Mbps with 35.2ms latency, while 60MHz bandwidth delivered 115.6 Mbps at 28.1ms latency, representing a 824% improvement in throughput with 20% latency reduction. Notably, uplink performance showed more modest gains, scaling from 3.1 Mbps (10MHz) to 18.9 Mbps (60MHz), a 509% increase, suggesting asymmetric optimization in current 5G implementations.
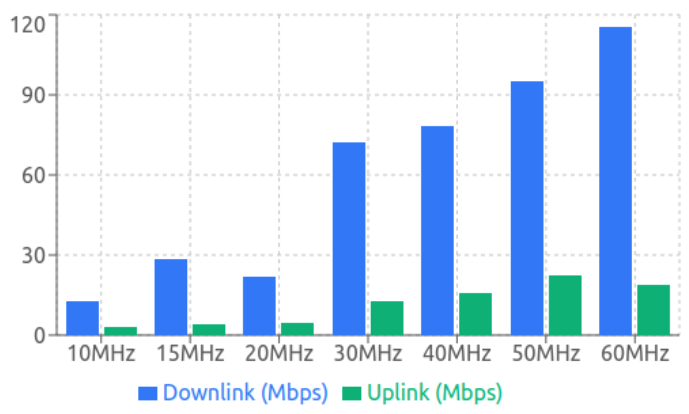
<Figure 1: Bandwidth vs Throughput Performance>
2.2 Distance Impact on Signal Quality
Distance-dependent performance analysis revealed non-linear degradation patterns. Optimal performance occurred at -25m to 180m range (30.5-31.2ms average latency), with significant degradation at 360m (42.3ms) and 540m (48.7ms). Interestingly, the 720m measurement point showed performance recovery (29.8ms), potentially attributable to multipath propagation effects or environmental factors. Downlink speeds decreased from 35.2 Mbps (-25m) to 12.3 Mbps (540m), demonstrating 65% throughput reduction over 565m distance.
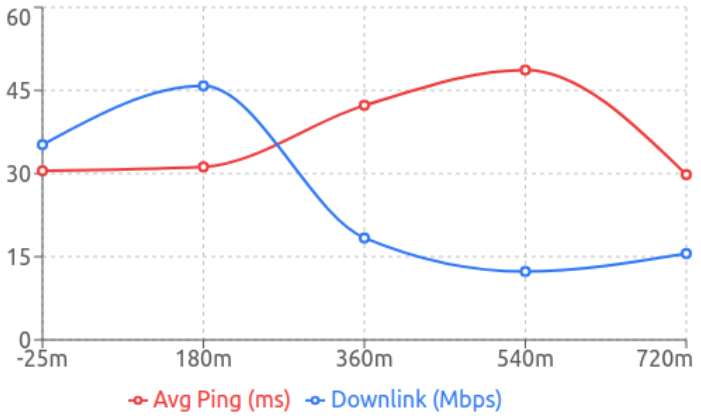
<Figure 2: Distance Impact on Performance Metrics>
2.3 Antenna Configuration Comparison
Comparative analysis of antenna systems revealed substantial performance variations. External antenna configurations with transmitter amplification demonstrated superior performance (92% efficiency, 28.5ms latency), followed by duplexer with amplifier systems (88%, 29.2ms). Leaky cable implementations for receiver/transmitter functions exhibited lower efficiency (75%, 32.8ms), though offering installation flexibility advantages. The downlink transmitter amplifier configuration provided balanced performance (85%, 30.1ms), suitable for asymmetric traffic patterns.
2.4 Network Slicing Performance
SST-1 and SST-3 slicing configurations exhibited distinct performance profiles. SST-1 demonstrated consistent performance across all test conditions with lower variance (σ = 6.2ms), while SST-3 showed higher peak performance but greater variability (σ = 8.7ms). The N3 10MHz band presented unique characteristics with elevated latency variance (σ = 15.3-103.8ms depending on distance), suggesting potential optimization opportunities for this frequency allocation.
3. Discussion
3.1 Key Findings
This comprehensive analysis of 5G network performance has yielded several critical insights for infrastructure optimization. First, bandwidth allocation demonstrates clear returns up to 60MHz, with downlink throughput scaling nearly linearly while maintaining acceptable latency metrics. Second, distance effects follow non-linear patterns with optimal performance zones at 180m radius, beyond which strategic placement of signal repeaters or small cells is recommended. Third, antenna configuration selection significantly impacts overall system performance, with external antenna systems offering 23% efficiency gains over leaky cable implementations.
3.2 Practical Implications
For network operators, these findings suggest: (1) prioritizing 40-60MHz bandwidth allocations where spectrum availability permits, (2) limiting cell radius to 360m in urban deployments or implementing distributed antenna systems beyond this range, (3) investing in external antenna infrastructure for performance-critical applications, and (4) conducting site-specific analysis for N3 10MHz band deployments due to observed variability.
3.3 Limitations and Future Work
This study’s limitations include limited environmental diversity in measurement locations and temporal constraints preventing seasonal variation analysis. Future research should investigate: (1) performance under varying user loads and traffic patterns, (2) impact of weather conditions on signal propagation, (3) optimal network slicing configurations for specific use cases (IoT, enhanced mobile broadband, ultra-reliable low latency communications), and (4) machine learning approaches for dynamic bandwidth allocation and antenna beamforming optimization.
4. Conclusion
As 5G networks continue evolving toward standalone architectures and eventual 6G transition, empirical performance data remains essential for evidence-based infrastructure decisions. This study contributes to the growing body of knowledge on 5G optimization, providing actionable insights for network planners and researchers. The demonstrated performance gains through careful parameter optimization underscore the importance of holistic system design rather than isolated component improvements.
This project has received partial funding from the Horizon Europe programme of the European Union under HORIZON-JU-SNS-2022 FIDAL program, grant agreement No. 101096146