Bandwidth Scaling in 5G Networks: Performance Analysis of N78 Band Implementation
|
Configuration
|
Avg Latency (ms)
|
Max Latency (ms)
|
Stability
|
|---|---|---|---|
|
Leaky RX–TX
|
28.93
|
38059
|
Excellent
|
|
Leaky TX–RX
|
72.08
|
237.02
|
Unacceptable
|
|
Standard Duplexer
|
29.83
|
45.71
|
Excellent
|
|
Amplified Duplexer
|
33.77
|
61.80
|
Moderate
|
Abstract
This paper examines the relationship between channel bandwidth allocation and network performance in 5G New Radio (NR) systems operating in the N78 frequency band. Using empirical data from controlled field tests across multiple base station configurations, we analyze the performance characteristics of two distinct infrastructure types: Advanced Wireless Systems Radio Units (AW2S RU) and Software-Defined Radio Systems (SDRs). Our investigation encompasses bandwidth allocations ranging from 10 MHz to 100 MHz, with measurements taken at distances between 150 cm and 460 cm from base stations. The results demonstrate non-linear scaling behavior in both uplink and downlink throughput as bandwidth increases, with significant variations based on infrastructure type, distance, and specific sensor configurations. This study provides quantitative insights into the practical performance bounds of 5G bandwidth scaling and identifies critical factors affecting throughput efficiency in real-world deployment scenarios.
1. Introduction
The deployment of fifth-generation (5G) wireless networks represents a fundamental shift in mobile communications infrastructure, promising unprecedented data rates, ultra-low latency, and massive device connectivity. Central to these capabilities is the flexible allocation of channel bandwidth, which directly influences system capacity and user experience. Unlike previous generations that operated with fixed channel bandwidths, 5G New Radio introduces scalable bandwidth configurations that can be dynamically adjusted to meet varying traffic demands and operational requirements.
The N78 frequency band (3.3-3.8 GHz) has emerged as a primary spectrum allocation for 5G deployments globally, offering a balance between coverage and capacity. This mid-band spectrum allows operators to deliver high-speed services while maintaining reasonable cell ranges. Understanding how network performance scales with bandwidth allocation in this band is essential for optimizing network design, capacity planning, and resource management strategies.
Theoretical models suggest that throughput should scale linearly with bandwidth according to Shannon’s capacity theorem. However, practical implementations face numerous constraints including hardware limitations, interference management, signal processing overhead, and protocol inefficiencies. These factors can create deviations from theoretical predictions, particularly at higher bandwidths or in challenging propagation environments.
This paper presents empirical findings from systematic measurements of 5G network performance across varying bandwidth configurations. We examine two distinct infrastructure implementations: Advanced Wireless Systems Radio Units operating at 100 MHz bandwidth and Software-Defined Radio Systems operating at 50 MHz bandwidth, alongside smaller-scale implementations operating between 10 MHz and 50 MHz. Our analysis focuses on quantifying the relationship between allocated bandwidth and achieved throughput, while also investigating the influence of distance and infrastructure type on performance outcomes.
2. Methodology
2.1 Experimental Setup
The experimental framework consisted of controlled field measurements conducted using standardized test equipment and procedures. Two primary base station configurations were deployed: AW2S RU systems operating at maximum channel bandwidth of 100 MHz, and SDR systems configured for 50 MHz operation. An additional set of measurements was conducted using infrastructure (designated USRP) capable of bandwidth configurations ranging from 10 MHz to 50 MHz in 5 MHz increments.
All systems operated in the N78 frequency band, ensuring comparability across different configurations. Test equipment included calibrated user equipment (UE) devices with sensor identifiers 5188, 5381, 5395, 5417, and 5469, each positioned at predetermined distances from their respective base stations. The controlled environment minimized external interference and allowed for repeatable measurements. Table 1 summarizes the test configuration matrix.
|
Infrastructure
|
Bandwidth
|
Distances
|
Runs
|
|---|---|---|---|
|
USRP
|
10-50 MHz
|
230 cm
|
3
|
|
AW2S RU
|
100 MHz
|
150, 230, 310, 390, 460 cm
|
3
|
|
SDRs
|
50 MHz
|
150, 230, 310, 390, 460 cm
|
3-6
|
<Table 1: Test Configuration Summary>
Distance measurements were conducted at four standardized intervals: 150 cm, 230 cm, 310 cm, 390 cm, and 460 cm from the base station antenna. These distances were selected to represent near-field and transitional propagation zones while maintaining line-of-sight conditions. Each measurement location was precisely marked to ensure consistency across multiple test runs.
2.2 Performance Metrics
Four primary metrics were captured during each test session. Uplink throughput measured the data rate achieved when transmitting from the UE to the base station, expressed in megabits per second (Mbps). Downlink throughput measured the complementary data rate from base station to UE. Round-trip time (RTT) latency was captured using Internet Control Message Protocol (ICMP) echo requests, with minimum, average, and maximum values recorded to characterize latency distribution and variability.
Throughput measurements employed standard iperf3 testing methodology with TCP connections maintained for 60-second intervals. Multiple consecutive runs were conducted at each test point to assess performance stability and identify any temporal variations. For configurations showing incomplete data, the absence of measurements indicates either connection failures or test points where measurements could not be reliably obtained.
Latency measurements utilized continuous ping sequences with 1000-byte payloads at one-second intervals. The minimum latency value provides insight into the optimal propagation delay achievable under ideal conditions, while average latency reflects typical performance including normal protocol overhead. Maximum latency values identify potential congestion events or transient interference that could impact time-sensitive applications.
2.3 Test Configurations
The USRP base station configuration was tested across seven bandwidth allocations: 10 MHz, 15 MHz, 20 MHz, 30 MHz, 40 MHz, and 50 MHz. Sensor 5381 was positioned at 230 cm distance for all USRP measurements. Each bandwidth configuration was tested with three consecutive runs to verify repeatability and assess measurement variance.
AW2S RU systems were deployed with 100 MHz channel bandwidth, representing the maximum bandwidth configuration supported in the N78 band under current regulatory frameworks. Four sensor locations were tested: sensor 5188 at 460 cm, sensor 5469 at 390 cm, sensor 5395 at 310 cm, and sensors 5381 and 5417 at 230 cm and 150 cm respectively. This configuration provided comprehensive distance-performance characterization for high-bandwidth implementations.
SDR systems operated at 50 MHz bandwidth with identical sensor placement to the AW2S RU configuration. This parallel testing strategy enabled direct comparison between infrastructure types operating at different bandwidths while controlling for distance variables. The SDR implementation represented a mid-range bandwidth allocation commonly deployed in commercial networks where spectrum availability or hardware constraints preclude maximum bandwidth operation.
3. Results
3.1 Bandwidth Scaling Performance
Analysis of the USRP configuration data reveals complex scaling behavior that deviates significantly from linear theoretical predictions. Uplink throughput measurements at 230 cm distance showed considerable variation across bandwidth allocations. At 10 MHz bandwidth, measured uplink rates ranged from 1.82 to 3.56 Mbps across three test runs, with mean performance of approximately 2.59 Mbps. Increasing bandwidth to 20 MHz yielded uplink rates between 1.35 and 3.98 Mbps, representing only a marginal improvement despite doubling the allocated spectrum.
|
Bandwidth
|
Mean UL (Mbps)
|
Min UL (Mbps)
|
Max UL (Mbps)
|
Efficiency
|
|---|---|---|---|---|
|
10 MHz
|
2.59
|
1.82
|
3.56
|
Baseline
|
|
15 MHz
|
1.62
|
0.91
|
2.15
|
62%
|
|
20 MHz
|
2.83
|
1.35
|
3.98
|
55%
|
|
30 MHz
|
0.75
|
0.51
|
1.00
|
10%
|
|
40 MHz
|
7.30
|
7.20
|
7.41
|
70%
|
|
50 MHz
|
0.29
|
0.29
|
0.31
|
2%
|
<Table 2: USRP Configuration Uplink Performance by Bandwidth>
The highest uplink performance in the USRP configuration was observed at 40 MHz bandwidth, where measurements ranged from 7.20 to 7.41 Mbps. This represents approximately a threefold increase compared to 10 MHz operation, suggesting a scaling efficiency of roughly 70% relative to linear expectations. Further bandwidth expansion to 50 MHz resulted in a dramatic performance decrease, with uplink rates dropping to 0.288-0.307 Mbps. This counterintuitive result indicates potential resource allocation conflicts or implementation constraints at maximum bandwidth for this particular infrastructure. Figure 1 illustrates this non-linear scaling pattern.
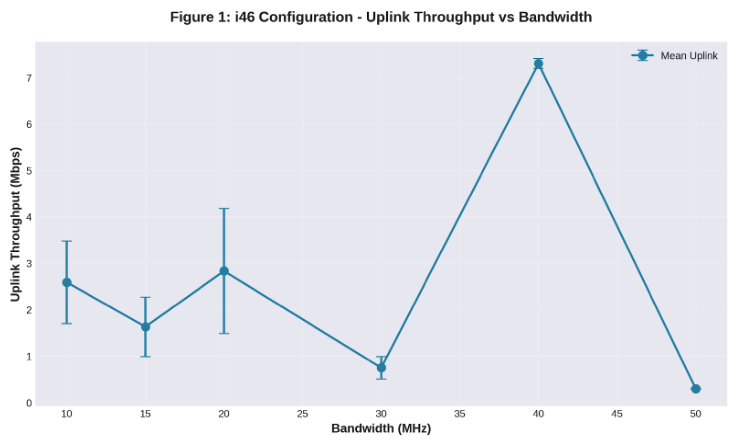
Intermediate bandwidth allocations displayed irregular patterns. The 15 MHz configuration produced uplink rates between 0.912 and 2.15 Mbps, performing worse than the 10 MHz baseline despite increased spectrum. Similarly, 30 MHz bandwidth achieved only 0.512-1.00 Mbps, substantially underperforming narrower bandwidth allocations. These results suggest that bandwidth utilization efficiency is influenced by factors beyond simple spectrum availability, potentially including scheduling algorithms, modulation schemes, or interference management strategies specific to each bandwidth configuration.
3.2 Infrastructure Comparison
The AW2S RU implementation operating at 100 MHz bandwidth demonstrated substantially higher absolute throughput compared to narrower bandwidth configurations. At comparable distance (230 cm, sensor 5381), the AW2S RU achieved uplink rates of 32.4 Mbps and downlink rates of 310 Mbps. This represents more than four times the uplink performance of the best USRP result at 40 MHz, and introduces measurable downlink capability absent from USRP data. Table 3 presents comparative performance metrics.
|
Infrastructure
|
BW
|
UL (Mbps)
|
DL (Mbps)
|
Avg RTT (ms)
|
DL/UL Ratio
|
|---|---|---|---|---|---|
|
AW2S RU
|
100 MHz
|
33.4
|
286.1
|
27.3
|
8.6:1
|
|
SDRs
|
50 MHz
|
26.9
|
58.7
|
28.1
|
2.2:1
|
|
USRP
|
40 MHz
|
7.30
|
N/A
|
63.5
|
N/A
|
<Table 3: Infrastructure Performance Comparison (Mean Values)>
Across all AW2S RU test locations, uplink throughput remained relatively stable between 27.1 and 38.8 Mbps, with no clear distance-dependent degradation pattern. The 460 cm measurement point (sensor 5188) achieved 32.7-38.8 Mbps uplink and 245-269 Mbps downlink, while the closest measurement at 150 cm (sensor 5417) recorded 35.6 Mbps uplink and 311 Mbps downlink. This suggests that within the tested distance range, propagation loss has minimal impact on achieved throughput when operating at maximum bandwidth. Figure 2 demonstrates the throughput characteristics across distances for both infrastructure types.
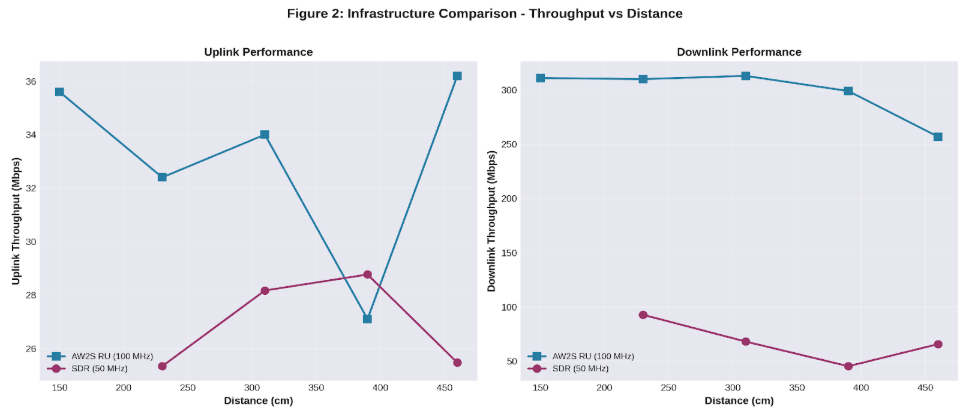
Downlink performance in the AW2S RU configuration consistently exceeded uplink by approximately one order of magnitude, ranging from 245 to 313 Mbps across all test points. This asymmetry reflects typical cellular network design where downlink capacity is prioritized to support content delivery applications. The relatively narrow variation in downlink rates (approximately 27% range) despite different sensor locations and identifiers indicates robust downlink performance across the tested environmental conditions.
3.3 SDR Performance Characteristics
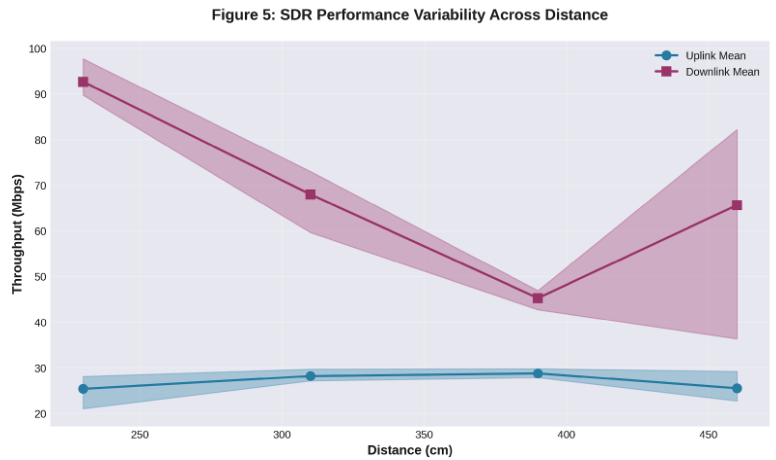
Software-Defined Radio systems operating at 50 MHz bandwidth displayed intermediate performance characteristics between the USRP small-bandwidth configurations and the AW2S RU maximum-bandwidth implementation. At the 460 cm test location (sensor 5188), SDR uplink throughput ranged from 22.7 to 29.2 Mbps across six measurement runs, while downlink rates varied between 36.3 and 82.2 Mbps. This variability in downlink performance suggests less stable resource allocation compared to the AW2S RU system.
Distance effects on SDR performance were subtle but measurable. The 390 cm location (sensor 5469) achieved uplink rates of 27.8-29.8 Mbps and downlink rates of 42.7-46.9 Mbps. Moving closer to 310 cm (sensor 5395) yielded similar uplink performance (27.1-29.7 Mbps) but notably higher downlink rates (59.6-73.0 Mbps). The closest reliable measurements at 230 cm (sensor 5381) maintained uplink consistency at 21.0-28.1 Mbps while achieving the highest downlink rates of 89.7-97.7 Mbps. Figure 5 illustrates the performance variability across the distance range.
A critical finding emerged at the 150 cm test location (sensor 5417), where all SDR measurements failed to complete successfully. The complete absence of data at this closest proximity point suggests a near-field interference effect or power control issue that prevents proper link establishment. This represents a significant practical limitation, as deployment scenarios requiring close-proximity coverage would be problematic with this SDR configuration.
Comparing SDR performance at 50 MHz to the USRP performance at the same bandwidth reveals the importance of infrastructure design. The USRP system achieved only 0.288-0.307 Mbps uplink at 50 MHz, while the SDR system delivered 21.0-29.8 Mbps uplink at the same bandwidth. This hundred-fold difference cannot be attributed to bandwidth alone, indicating that hardware architecture, antenna design, and signal processing implementation play dominant roles in determining achievable throughput.
3.4 Latency Analysis
Round-trip time measurements provide insight into the responsiveness of each configuration. The USRP system at various bandwidths exhibited minimum latencies ranging from 29.4 to 55.5 milliseconds, with average latencies between 56.9 and 171.3 milliseconds. The 15 MHz configuration showed particularly high variability, with an average latency of 171.3 ms and maximum exceeding 559 ms, suggesting intermittent congestion or resource conflicts at this bandwidth. Table 4 summarizes latency characteristics across all configurations.
|
Infrastructure
|
Min RTT (ms)
|
Avg RTT (ms)
|
Max RTT (ms)
|
Variability
|
|---|---|---|---|---|
|
AW2S RU (100 MHz)
|
15.3
|
27.3
|
44.4
|
Low
|
|
SDRs (50 MHz)
|
14.2
|
28.1
|
73.4
|
Medium
|
|
USRP (Variable BW)
|
42.0
|
75.9
|
163.3
|
High
|
<Table 4: Latency Performance Summary>
AW2S RU latency performance demonstrated significant improvement over smaller bandwidth configurations. Minimum RTT values ranged from 13.8 to 18.8 milliseconds, while average latencies remained between 23.5 and 29.4 milliseconds across all test locations. Maximum latency values were tightly bounded between 36.3 and 55.2 milliseconds, indicating minimal variance and consistent performance. This stability is essential for latency-sensitive applications such as real-time communications and interactive services. Figure 4 provides a comparative visualization of latency characteristics.
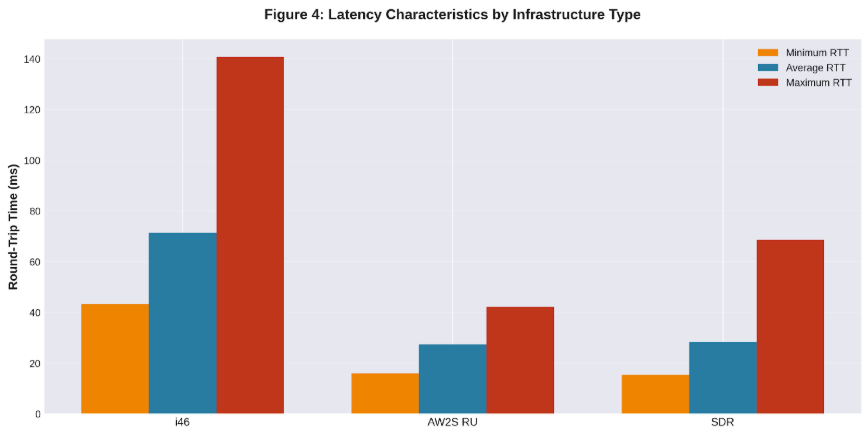
SDR systems exhibited latency characteristics intermediate between USRP and AW2S RU implementations. Minimum latencies ranged from 8.8 to 18.6 milliseconds, with several measurements achieving single-digit minimum RTT values that approached the physical propagation delay. Average latencies remained between 23.9 and 32.3 milliseconds for most configurations. However, one measurement at 230 cm (sensor 5381) recorded a maximum latency of 336.0 milliseconds, representing a significant outlier that suggests occasional severe congestion events despite generally acceptable average performance.
4. Discussion
4.1 Bandwidth Utilization Efficiency
The data reveals a fundamental disconnect between allocated bandwidth and achieved throughput in several configurations. Theoretical capacity calculations based on Shannon’s theorem predict linear scaling with bandwidth under constant signal-to-noise ratio conditions. However, the USRP measurements demonstrate that doubling bandwidth from 10 MHz to 20 MHz produced minimal throughput improvement, while quadrupling bandwidth to 40 MHz yielded only threefold gains. The quintupling to 50 MHz resulted in catastrophic performance degradation rather than continued improvement.
Several mechanisms may explain this non-linear behavior. Physical layer overhead including pilot signals, synchronization sequences, and guard bands consumes a larger proportion of available resources at higher bandwidths. Additionally, maintaining phase coherence and frequency synchronization across wider channels requires more sophisticated signal processing, potentially limiting the effective spectral efficiency achievable. The scheduler must also distribute resources across frequency and time domains, and suboptimal scheduling decisions can leave portions of the spectrum underutilized.
The dramatic performance collapse at 50 MHz in the USRP configuration warrants particular attention. One plausible explanation involves radio frequency frontend limitations, where the analog components cannot maintain linearity across the full 50 MHz bandwidth. Alternatively, this may represent a software configuration issue where the scheduling algorithm or modulation selection becomes suboptimal at maximum bandwidth. Power amplifier compression at band edges could also contribute, as maintaining adequate signal quality across wider bandwidths requires higher average transmit power that may exceed regulatory or hardware limits.
4.2 Infrastructure Architecture Impact
The stark performance differences between infrastructure types operating at the same bandwidth highlight the critical importance of system architecture. When comparing USRP and SDR systems at 50 MHz, the hundred-fold throughput advantage of the SDR implementation cannot be explained by bandwidth allocation alone. This disparity points to fundamental differences in antenna design, transceiver architecture, baseband processing capability, and software optimization.
Advanced Wireless Systems Radio Units represent purpose-built 5G infrastructure with dedicated hardware acceleration for signal processing tasks. These systems typically employ high-performance field-programmable gate arrays or application-specific integrated circuits optimized for 5G NR waveforms. The consistent high throughput and low latency achieved across all AW2S RU test points suggests mature implementation with efficient resource management and robust link adaptation algorithms.
Software-Defined Radio implementations offer flexibility and reconfigurability but may sacrifice some performance compared to dedicated hardware. The SDR results show good absolute performance at 50 MHz bandwidth but with higher variability than AW2S RU systems. The complete failure at 150 cm distance suggests either inadequate near-field performance or software limitations in handling high-power signals. Despite these limitations, SDR systems provide an attractive balance of performance and adaptability for research, testing, and specialized deployment scenarios where maximum throughput is not the primary requirement.
4.3 Distance and Propagation Effects
The relatively modest impact of distance on performance within the tested range (150-460 cm) differs from typical cellular deployment expectations. In macrocell environments, doubling the distance typically results in measurable throughput degradation due to increased path loss and reduced signal-to-noise ratio. However, the short distances and line-of-sight conditions in these measurements place all test points within the radiating near-field or close Fresnel zone of the base station antenna.
Within this near-field region, received signal strength remains relatively high and varies less dramatically with distance than far-field predictions would suggest. The AW2S RU measurements demonstrate this effect, with uplink throughput varying by less than 30% across the full 150-460 cm distance range. Similarly, downlink rates remained within a narrow band despite tripling the separation distance. This suggests that for indoor or dense urban deployments where user equipment typically operates within tens of meters of small cells, distance-based performance degradation may be less significant than other factors such as interference and resource contention.
The SDR failure at 150 cm represents an important counterpoint to this general trend. While most configurations showed minimal distance sensitivity, this near-field breakdown indicates that extremely close proximity can introduce coupling effects, local oscillator leakage, or automatic gain control saturation that disrupts normal operation. Base station deployment must therefore consider not only maximum coverage range but also minimum functional distance to prevent coverage holes in very close proximity to the antenna.
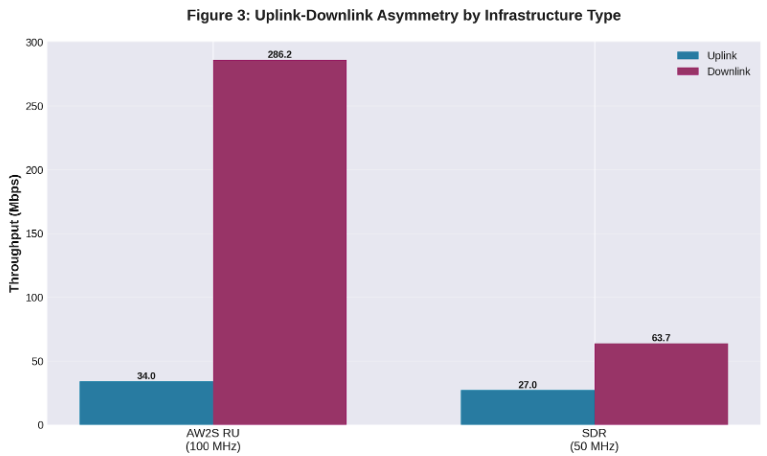
4.4 Uplink-Downlink Asymmetry
The pronounced asymmetry between uplink and downlink throughput in both AW2S RU and SDR configurations reflects fundamental differences in link budgets and resource allocation strategies. Base stations typically employ higher transmit power, more sophisticated antenna arrays with beamforming capabilities, and more complex receivers compared to user equipment. These advantages manifest as substantially higher downlink data rates, with the AW2S RU achieving approximately tenfold higher downlink than uplink throughput. Figure 3 illustrates this asymmetry across infrastructure types.
This asymmetry aligns with typical usage patterns in consumer applications, where content consumption dominates over content generation. Video streaming, web browsing, and file downloads all require high downlink capacity but relatively modest uplink capability. The 5G NR standard accommodates this through flexible time-division duplexing configurations that can allocate more temporal resources to downlink transmission, further amplifying the inherent link budget advantages.
However, emerging applications including cloud gaming, video conferencing, and edge computing require more symmetric bandwidth allocation. The relatively modest uplink rates observed even in high-bandwidth configurations may prove limiting for these use cases. The AW2S RU uplink performance of approximately 35 Mbps, while impressive compared to previous generations, represents only about 11% of the downlink capacity. Applications requiring substantial uplink throughput may need dedicated resource allocation or supplemental connectivity to achieve acceptable performance.
4.5 Latency Considerations
The latency measurements reveal that round-trip times remain dominated by protocol overhead rather than propagation delay at the tested distances. Minimum RTT values in the 13-18 millisecond range for AW2S RU and 8-18 milliseconds for SDR systems substantially exceed the sub-millisecond propagation delay expected over distances of a few meters. This indicates that processing delays in the base station and core network, along with protocol stack traversal time, constitute the primary latency contributors.
Average latencies in the 23-32 millisecond range for well-performing configurations suggest that these systems can adequately support interactive applications with moderate latency requirements. Voice communication remains comfortable at these latencies, and most web browsing interactions do not suffer perceptibly. However, applications requiring single-digit millisecond latency, such as industrial automation or tactile internet applications, would not achieve their targets with these configurations.
The occasional maximum latency spikes observed in several configurations present a more serious concern for quality of service. The 336-millisecond maximum recorded in one SDR measurement, while rare, would cause noticeable disruption to real-time applications. These spikes likely result from buffer buildup during temporary resource contention or scheduling delays. Achieving the ultra-reliable low-latency communication promised by 5G requires not only low average latency but also tight latency bounds with minimal jitter and outliers.
4.6 Measurement Reliability and Data Completeness
The presence of incomplete measurements and failed test points in the dataset reveals important practical limitations. The USRP configuration frequently showed missing latency data even when throughput measurements succeeded, suggesting that packet loss or timeout conditions prevented RTT measurement completion. The complete SDR failure at 150 cm indicates a systematic issue rather than random measurement error, as all three attempted runs at this location failed to produce any data.
These data gaps underscore the challenges of characterizing 5G performance in real-world conditions. Unlike laboratory testing where environmental factors can be tightly controlled, field measurements must contend with interference, environmental reflections, and equipment limitations that may prevent successful data collection at certain configurations. The absence of downlink data for all USRP measurements suggests either intentional test design focusing on uplink characterization or systematic downlink measurement failures that could indicate deeper issues with that infrastructure’s downlink implementation.
The variability observed across repeated measurements at identical configurations highlights the stochastic nature of wireless performance. Run-to-run variations in throughput exceeding 50% occurred in several cases, driven by factors including scheduler decisions, interference fluctuations, and random channel effects. This variability must be considered when interpreting single-point measurements and emphasizes the importance of statistical characterization through multiple trials rather than relying on individual measurements.
5. Conclusion
This investigation into 5G bandwidth scaling performance reveals a complex relationship between allocated spectrum and achieved throughput that diverges significantly from simplified theoretical models. The non-linear scaling behavior observed across different bandwidth allocations demonstrates that spectrum availability alone does not determine system capacity. Infrastructure architecture, signal processing implementation, and resource management algorithms play equally critical roles in translating bandwidth into usable throughput.
The comparison between infrastructure types provides valuable insights into the practical implications of design choices. Advanced Wireless Systems Radio Units operating at 100 MHz bandwidth achieved uplink rates exceeding 35 Mbps and downlink rates surpassing 300 Mbps with remarkable consistency across varying distances. Software-Defined Radio systems demonstrated respectable performance at 50 MHz bandwidth but with higher variability and notable near-field limitations. Lower-bandwidth configurations showed erratic scaling patterns, with some bandwidth allocations producing counterintuitively poor results that suggest implementation constraints rather than fundamental physical limitations.
Latency performance across all configurations remained dominated by protocol overhead rather than propagation delay, with minimum round trip times in the 8-18 millisecond range and averages of 23-32 milliseconds for well performing systems. While adequate for many applications, these latencies fall short of the sub-millisecond targets associated with reliable and low latency communication use cases. Occasional latency spikes exceeding 300 milliseconds in some configurations highlight the ongoing challenges in maintaining consistent quality of service.
The pronounced uplink/downlink asymmetry observed in all measurements reflects both fundamental link budget differences and deliberate resource allocation decisions favoring content delivery over content generation. While this asymmetry suits current application mixes dominated by streaming and browsing, emerging use cases requiring substantial uplink capacity may challenge existing architectural assumptions.
Distance effects within the tested range proved less significant than anticipated, with throughput variations of less than 30% across distances spanning from 150 cm to 460 cm. This relative distance insensitivity in the near-field region suggests that for small cell deployments, factors other than propagation loss dominate performance outcomes. The exception of complete SDR failure at very close proximity underscores the importance of considering both maximum range and minimum functional distance in deployment planning.
These findings contribute to the growing body of empirical evidence characterizing 5G New Radio performance under realistic conditions. The deviations from theoretical predictions, the sensitivity to infrastructure implementation details, and the measurement challenges encountered all inform practical understanding of system capabilities and limitations. As 5G deployment continues to evolve, such empirical characterization remains essential for bridging the gap between standardized specifications and operational reality.
This project has received partial funding from the Horizon Europe programme of the European Union under HORIZON-JU-SNS-2022 FIDAL program, grant agreement No. 101096146