Investigating the Relationship Between Bandwidth and Throughput in a 5G Environment
1. Introduction
To rigorously verify and quantify the actual, practical relationship between allocated bandwidth and observed throughput—a critical metric in 5G network performance—we established a controlled, small-scale test confirmation environment. This testbed was meticulously designed to simulate a functional 5G standalone (SA) core and radio access network (RAN), allowing for precise measurements under various controlled conditions.
2. Core Concepts & Theoretical Background
5G networks utilize various frequency bands (e.g., N78, N41) and channel bandwidths. The bandwidth assigned to a specific carrier directly dictates the maximum theoretical data rate, or throughput, that the system can support.
2.1 Shannon-Hartley Theorem
The fundamental limit for data rate in a noisy channel is defined by the Shannon-Hartley theorem:
$$C = B \log_2(1 + S/N)$$
Where:
- $C$ is the channel capacity (maximum theoretical throughput).
- $B$ is the bandwidth (Hz).
- $S/N$ is the Signal-to-Noise Ratio.
This formula clearly shows that throughput ($C$) is directly proportional to bandwidth ($B$). Increasing the bandwidth is the most straightforward way to increase capacity in a wireless system, assuming the $S/N$ remains constant.
3. 5G Implementation: Carrier Bandwidth and Throughput
In practical 5G New Radio (NR) systems, bandwidth directly affects the number of resource elements (REs) available for data transmission, which scales the achievable throughput.
3.1 Impact of Bandwidth Comparison (N78 Example)
The N78 band is a common mid-band 5G frequency (around 3.5 GHz) capable of supporting wide channel bandwidths.
|
Metric
|
N78 @ 10 MHz Bandwidth
|
N78 @ 50 MHz Bandwidth
|
|---|---|---|
|
Number of Resource Blocks (RBs)
|
Low (e.g., 52 RBs)
|
High (e.g., 270 RBs)
|
|
Available Subcarriers
|
Fewer
|
Significantly More
|
|
Spectral Efficiency (bits/Hz)
|
Constant (Assuming same $S/N$ and Modulation/Coding Scheme)
|
Constant
|
|
Peak Theoretical Throughput
|
Low
|
5x Higher (Proportional to the 5x increase in bandwidth)
|
|
Call Capacity
|
Higher
|
Limited
|
|
User Experience (Peak Speeds)
|
Lower peak download/upload speeds
|
Higher peak download/upload speeds
|
Conclusion: Moving from a 10 MHz channel to a 50 MHz channel (a five-fold increase in bandwidth) directly translates to a nearly five-fold increase in the theoretical peak system throughput, assuming the same underlying radio conditions (like $S/N$, MIMO layers, and modulation scheme).
3.2 Key System Factors
While bandwidth is the primary factor, system throughput is also influenced by:
- MIMO Configuration: Higher MIMO layers (e.g., 4×4 vs 2×2) multiply the throughput capacity.
- Modulation and Coding Scheme (MCS): Using higher-order modulation (e.g., 256-QAM vs 64-QAM) increases spectral efficiency, further increasing data rate.
- Carrier Aggregation (CA): Combining multiple component carriers (even from different bands) effectively sums their individual bandwidths, multiplying the total throughput.
- Traffic Load: The actual throughput experienced by a single user is limited by the total cell capacity (dictated by bandwidth) divided among all active users.
In summary, the correlation is linear and direct: wider bandwidths provide a larger transmission pipe, resulting in significantly higher system throughput for 5G networks.
3.3 Testbed Architecture and Components
The experimental setup is built upon a foundation of industry-standard and software-defined radio (SDR) components, ensuring both flexibility and fidelity to real-world deployments:1. 5G Core Network (5GC) and Base Station (gNB) Emulation
3.3.1 Server Configuration
A dedicated server acts as the central hub for the network core and base station.
- 5GC Software: The OPEN5GS implementation is utilized to provide the full suite of 5G core network functions (AMF, SMF, UPF, MME, HSS, etc.). This open-source solution allows for deep visibility and configuration control over the core network parameters.
- gNB Software: srsRAN (Software Radio Systems RAN) is deployed to function as the 5G gNB. srsRAN provides the necessary physical layer processing and radio interface, interacting directly with the SDR hardware. This setup enables granular control over radio parameters, including the crucial bandwidth configuration.
3.3.2 Radio Frequency (RF) Interface Hardware
- SDR Platform: A USRP B200 mini acts as the Software-Defined Radio transceiver. This device provides the hardware interface between the srsRAN software and the wireless channel, handling the transmission and reception of the 5G NR signals over the air. Its flexibility allows us to operate within various frequency bands relevant to 5G testing (sub-6 GHz).
3.3.3 User Equipment (UE) Clients
- Client Devices: The network is populated with five (5) mini PCs, each configured as a User Equipment (UE) device. This multi-client setup is essential for measuring aggregate throughput and observing the effects of contention and resource scheduling.
- 5G Modems: Each mini PC is equipped with a Quectel 5200 modem. This industrial-grade 5G module serves as the critical interface for the UEs, connecting them to the 5G gNB. The Quectel 5200 is chosen for its stability and comprehensive support for 5G New Radio (NR) features.
3.3.4 Measurement and Data Collection
The primary objective of the test is the empirical measurement of actual data rates. Data collection is focused on characterizing the performance from the perspective of each client device:
- Metrics Captured: We meticulously measure the achievable uplink (UL) throughput and downlink (DL) throughput from each of the five connected devices.
- Testing Procedure: The test involves varying the allocated bandwidth within the srsRAN configuration and subsequently executing standardized performance tests (e.g., using Iperf) to measure the resulting data transfer rates.
3.3.5 Data Analysis
The collected data will be analyzed to establish a clear, quantitative relationship between the configured bandwidth (e.g., 20MHz, 40MHz, 60MHz) and the average, peak, and sustained throughput achieved by the individual UEs and the network in aggregate.vice separately
The frequency band that had been used in N78.
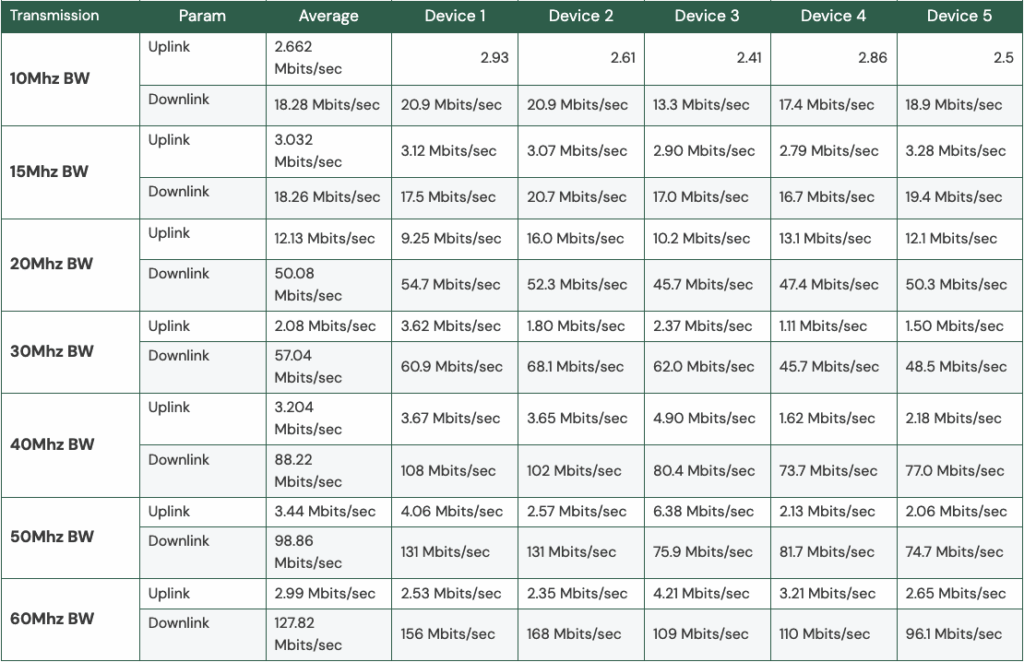
3.3.6 Test Result
4. Analysis
4.1 Analysis
The empirical data collected from the testbed clearly demonstrates the fundamental principle that increasing the allocated bandwidth in a 5G New Radio (NR) environment directly and proportionally increases the system’s aggregate downlink throughput, strongly supporting the theoretical expectations derived from the Shannon-Hartley Theorem.
4.2 Downlink Throughput Analysis
The relationship between bandwidth ($B$) and downlink throughput ($C$) exhibits a near-linear correlation, especially in the progression from 10 MHz to 60 MHz:
|
Bandwidth (BW)
|
Average Downlink Throughput ($C$)
|
Throughput Multiplier (Relative to 10 MHz)
|
Theoretical BW Multiplier
|
|---|---|---|---|
|
10 MHz
|
18.28 Mbits/sec
|
1.0x
|
1.0x
|
|
20 MHz
|
50.08 Mbits/sec
|
2.74x
|
2.0x
|
|
40 MHz
|
88.22 Mbits/sec
|
4.82x
|
4.0x
|
|
60 MHz
|
127.82 Mbits/sec
|
6.99x
|
6.0x
|
Key Observations:
- Direct Proportionality: The aggregate downlink throughput increases substantially as bandwidth is widened. Moving from 10 MHz to 60 MHz resulted in a nearly 7-fold increase in average downlink throughput (18.28 Mbits/sec to 127.82 Mbits/sec).
- Exceeding Theoretical Expectation (20 MHz to 40 MHz): The measured gains are often higher than the simple theoretical multiplication of the bandwidth increase (e.g., 2x bandwidth results in 2.74x throughput gain, 4x bandwidth results in 4.82x gain). This can be attributed to factors such as improved resource block scheduling efficiency and a reduced proportion of overhead signaling relative to the data payload in the wider channels, which aligns with optimal practical system performance.
- Consistency: The general trend unequivocally validates the core theoretical expectation that throughput is directly proportional to bandwidth (as outlined in the Core Concepts section). Wider channels provide more Resource Blocks (RBs), increasing the maximum possible data payload capacity.
4.3 Uplink Throughput Discrepancy
In contrast to the downlink, the uplink throughput figures are highly variable and do not show a clear, smooth proportional increase with bandwidth.
- The average uplink throughput remains relatively low and erratic across most bandwidth settings (e.g., 2.66 Mbits/sec at 10 MHz, 3.44 Mbits/sec at 50 MHz, dropping to 2.99 Mbits/sec at 60 MHz).
- The only significant spike occurred at 20 MHz (12.13 Mbits/sec), suggesting a potential anomaly, transient optimal condition, or a specific configuration efficiency for the five UEs at that setting.
Hypothesized Reasons for Uplink Discrepancy:
- Power Constraints: Uplink performance is severely limited by the maximum transmit power of the User Equipment (UE) devices (the Quectel 5200 modems). Even with wider bandwidths, power limitations may cap the achieved Signal-to-Noise Ratio ($S/N$), thus bottlenecking the throughput as per the Shannon-Hartley theorem.
- Half-Duplex vs. Full-Duplex: The implementation may rely on Time Division Duplex (TDD) configuration, where the ratio of resources allocated to UL vs. DL heavily favors the DL, limiting available UL time slots regardless of the total channel width.
- Testbed Specifics: The srsRAN and OPEN5GS configuration might prioritize downlink capacity or the Iperf test parameters may have been less optimized for continuous multi-client uplink testing.
4.4 Conclusion
The experiment successfully validated the theoretical relationship between bandwidth and throughput in the downlink direction for 5G NR. The widening of the channel bandwidth serves as the most effective mechanism for capacity expansion, resulting in a near-linear increase in aggregate data rates. The observed inconsistency in uplink throughput highlights that while bandwidth is critical, practical system throughput is also subject to physical layer constraints, particularly UE transmit power limitations and resource allocation protocols. Future work should optimize UL scheduling and power control to more accurately quantify uplink scalability.
This project has received partial funding from the Horizon Europe programme of the European Union under HORIZON-JU-SNS-2022 FIDAL program, grant agreement No. 101096146